Can AI predict the next big flood before it happens?
Computers are learning from past big ones to point to climate patterns of risk

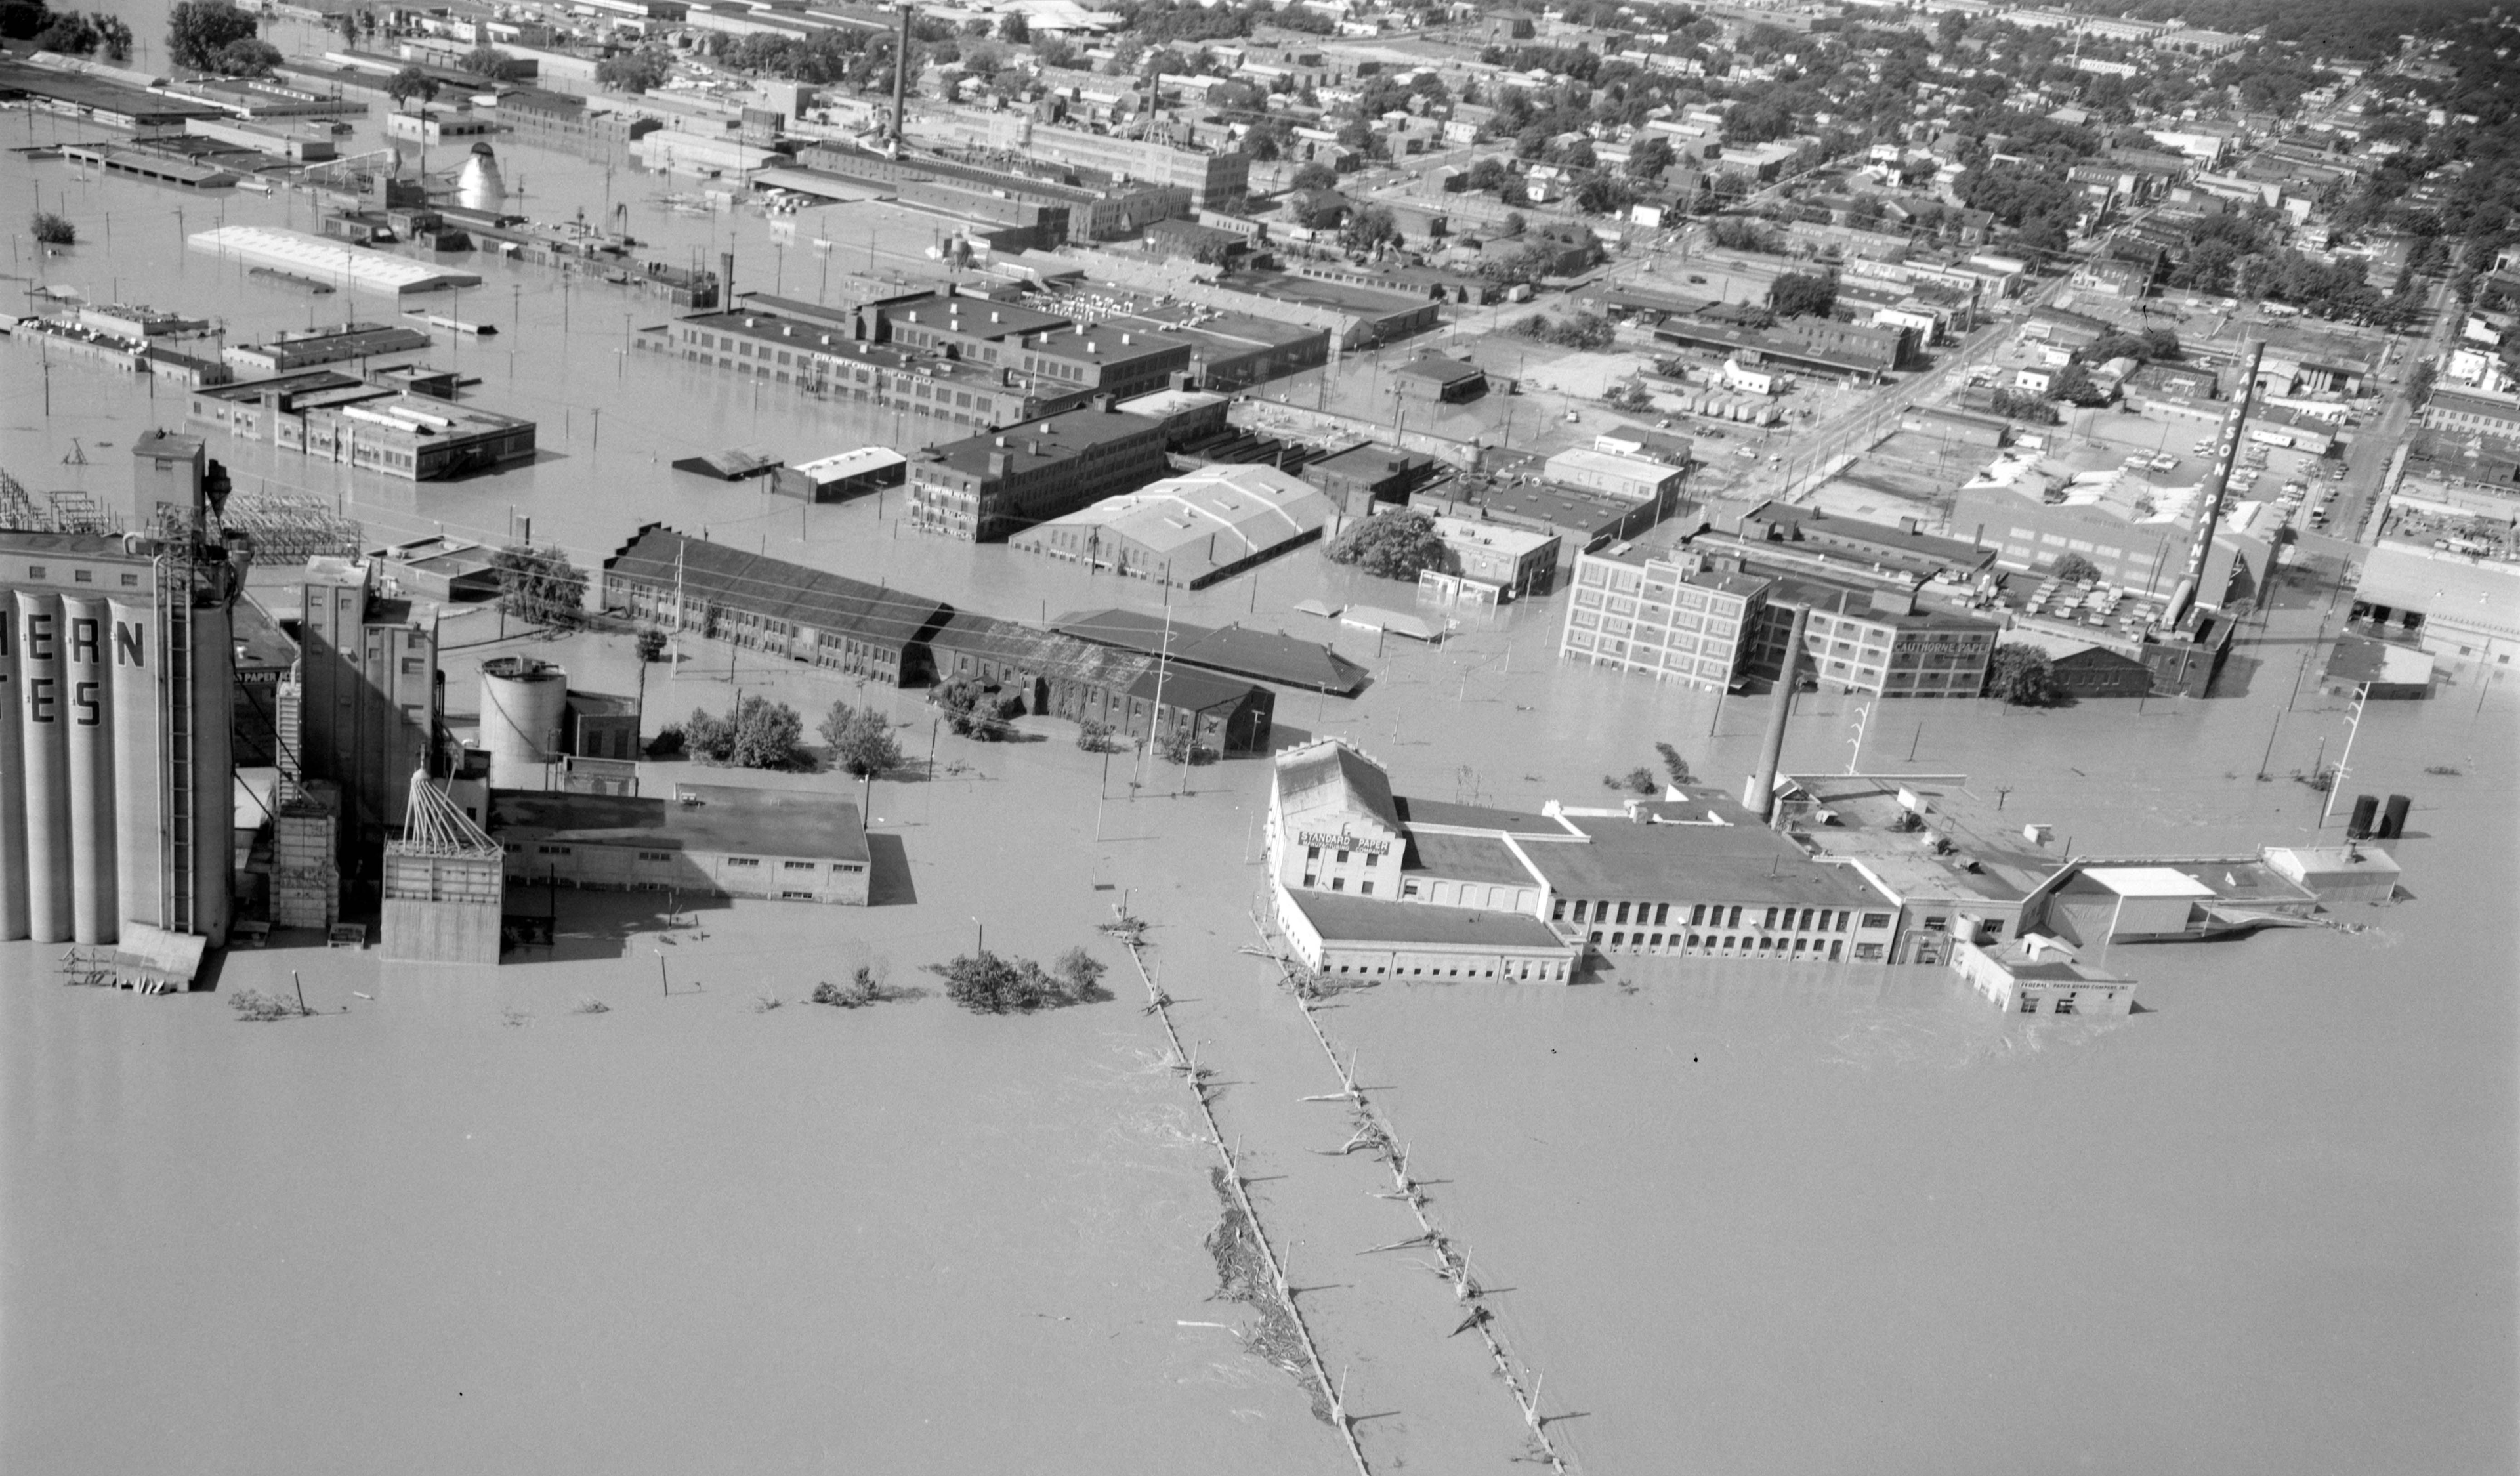
Library of Virginia via Flickr
It's hard to grow up in the northeastern Pennsylvania's Wyoming Valley without knowing the details of the '72 flood by heart. The water was so strong it uprooted a section of the historical Forty Fort cemetery at its bend, leaving caskets floating in the streets and body parts on porches and in basements. To this day, my mother describes what it was like to be chased from her home when the Susquehanna River rushed through narrow, city streets.
Over 220,000 people were left stunned and homeless for years.
Climate change is creating more intense hurricanes to form. In turn, they bring more intense weather events on shore, increasing the likelihood that rivers will experience more precipitation than they can handle. Hurricane Agnes, the Atlantic hurricane that caused the ‘72 flood, stalled over Pennsylvania as a Tropical Storm and dumped over 12 inches of rain on Harrisburg, the capital city along the Susquehanna River in less than 24 hours.
A total rainfall map of Hurricane Agnes, 1972, covering the entire eastern seaboard.
In an article published last year in Scientific Reports, a collaboration of scientists from around the United States present the first use of machine learning to identify atmospheric circulation patterns associated with extreme river floods, such as the flood of ‘72. The scientists, Katherine Schlef, Hamid Moradkhani, and Upmanu Lall hope that this technology will allow them to better understand what causes extreme floods on a continental scale.
The group formed self-organizing maps (SOMs), a machine learning tool that defines groups of data. The program looks for patterns and uses this information to rapidly sort new data points.
The researchers performed the most in depth analysis of extreme river flooding in the contiguous United States to date. They divided the country into three regions: West (from the Pacific to near the Mississippi River), Central (from the Mississippi to the Appalachians), and East (everything east of Appalachia). For each region, they collected past atmospheric patterns associated with flooding events to classify floods into groups. They only used record floods to develop the groups of atmosphere patterns and then assigned all other as "peaks-over-threshold" (POT) floods.
Both record and POT floods are extreme floods. Record floods are the worst ever in a region, while POT floods are all the others that are really bad without breaking records. The group used record floods (169 in the West, 316 in Central, and 196 in the East) to develop the SOMs, the machine learning maps. Then, they assigned the remaining POT floods (1,223 in the West, 2,183 in Central, and 1,467 in the East) into the groups created by the record floods.
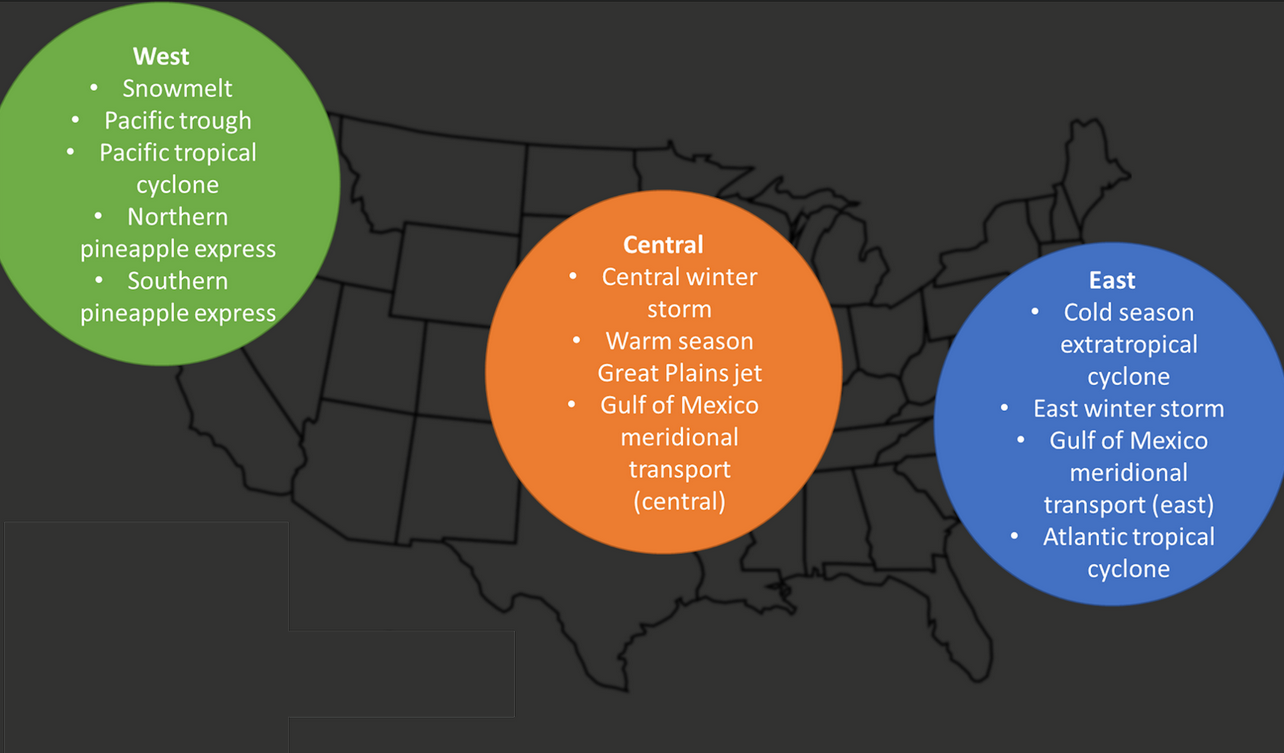
The continental United States divided into three broad regions for the purposes of studying historical climate patterns: West, Central, and East.
Christina Marvin
Based on the machine’s clustering performance, the West region has five circulation patterns associated with extreme floods, the Central region has three, and the East region has four.
The West sees patterns coming off of the Pacific ocean, like troughs, cyclones and moisture flows called "pineapple expresses," as well as snowmelt. In contrast, the Central region, which only borders the Atlantic Ocean in the south, sees winter storms, the Great Plains jet, and heat transport from the Gulf of Mexico. The East is also susceptible to winter storms and Gulf of Mexico heat transfer, as well as various types of hurricanes coming off of the Atlantic Ocean. As would be expected, there is some overlap due to geographical proximity and movement. The group further divided the 12 atmospheric patterns into four primary categories. It is these categories of pattern types that should be most closely analyzed to inform future flood predictions.
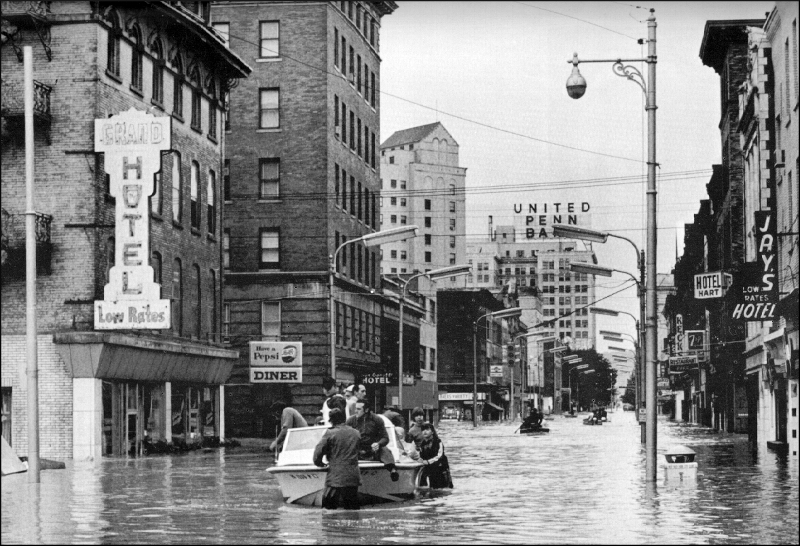
Flooding in Wilkes-Barre, Pennsylvania, after Hurricane Agnes in 1972.
Based on their data the Atlantic tropical cyclone pattern in the mid-Atlantic states (East region) caused the large precipitation event that led to the flood of ‘72 in Pennsylvania. This appears to be the first time any research group has identified atmospheric causes of extreme floods at a continental scale. They hope this knowledge will be used to inform communities of future flood risks.
The researchers admit that their approach has limitations. Some areas provide more accurate predictions than others simply because there is more historic data on river levels. Other environmental conditions beyond atmosphere patterns, such as snowpack and soil moisture, may affect the occurrence of river flooding. Machine learning also may not provide an accurate assessment of data that is moving or is too large to put into one category, like the atmosphere. Even if a circulation system moves or is large enough to be in multiple regions, the program will assign it into a single category.
Other scientists, like meteorologists, are also using machine learning to create better forecasting. A collaboration between the National Oceanic and Atmospheric Administration (NOAA) and the University of Colorado, Boulder applied machine learning in precipitable water data to more accurately identify tropical cyclones. Another group of scientists from the Czech Republic and Slovakia used machine learning to input additional parameters in an effort to enhance accuracy in the European Center for Medium-Range Weather Forecast model, the standard forecasting model in Europe.
Scientists hope more accurate and comprehensive prediction models will help communities adapt to changes in the ocean and precipitation levels caused by climate change before it's too late. The flood of ‘72 was supposed to be an extremely rare – 1 in 300 – event. But in 2011, Tropical Storm Lee hit. It's not every day that you watch a powerful river come very close to breaking its way through a giant flood wall into your deserted town. Levees built after the ‘72 flood protect up to 41 feet, but the water in 2011 crested at over 42 feet. National Weather Service hydrologist Jim Brewster told Pennsylvania's The Citizen's Voice that some extra "freeboard" provided extra protection that was far from guaranteed.
To aid communities in flood risk mitigation, the scientists on the atmospheric circulation project have made their results and other relevant information publicly available. Here, anyone can explore detailed information for each record flood that has been developed.
Even bodies of water far from an ocean shore are not immune to devastating floods. As global warming intensifies, more and more moisture drags onto the mainland, endangering communities not just along rivers but other bodies of water such as lakes and streams.